To address differnt issues in Cox’s Bazar district, the District Administration and the Cabinet Division decided to start a Development Plan for Cox’s Bazar District. While encouraging social cohesion, the strategy matched with national development plans and the Sustainable Development Goals. The plan’s first phase established a framework for local responses to sectoral concerns and priorities, and the second phase, which is now underway, will address the District’s medium-term growth and development needs.A dashboard is developed showing the development status of Cox’s Bazar district. The dashboard is developed using R-programming and three softwares: ArcMap, MS office, Rstudio.
Steps:
1. Data preparation using shapefile and excel associated software.
2. Building dashboard using shiny dashboard platform of R-programming
3. Deploying dashboard in shinyapp.io server and storing data in shinyapp.io server
The purpose of the dashboard is to improve the government of Bangladesh’s institutional ability to analyze, understand, and communicate physical and socio-economic feature characteristics, as well as to integrate associated information into development planning and budgeting, policies, and programs.

On the navigation bar there are 5 main tabs:
|Physical feature map| It shows the Headquarters, Educational Institution, Community clinic, Growth Centre, Socio-economic facilities, Rural Market, Cyclone shelter, Ashrayan with google imagery/ satellite imagery as base map.
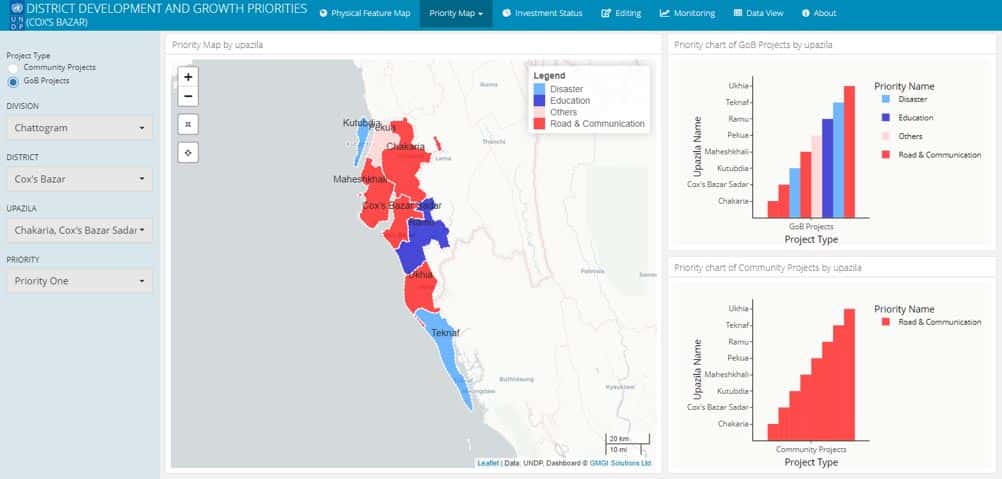
|Priority map| It has two sections: Upazila priority map and Union priority map. The upazila priority map shows upazila wise development priorities (Disaster, Education, Road and Communication) of the government. The union priority map shows union wise development priorities (Agriculture, Citizen service, disaster, drainage, economic activities, Education, energy, gender, Environment, health, ICT, Infrastructure, Law, Recreation facilities, WASH, Tourism, Road and Communication etc.) of the government.
|Investment status| It shows sector wise budget map and chart for development plans.
|About| It contains the download link of the manual for the dashboard.
|Data view| It shows details data of all the development plans.